Table 3.3 – Based on 2016 Census data on median household income. The highest possible SEIFA ranking is 130 – the lower the score the higher the social disadvantage.
Source: OLG, Time Series Data 2015-2016; ABS, Socio-Economic Indexes for Areas (SEIFA) 2016, March 2018; ABS, 2016 Census DataPacks, General Community Profile, Local Government Areas, NSW, Median Weekly Household Income and IPART calculations.
Geoff Helisma |
The Independent Pricing and Regulatory Tribunal (IPART) has approved Clarence Valley Council’s application to implement a special rate variation (SRV), which was adopted by councillors at last week’s council, apart from Cr Debrah Novak.
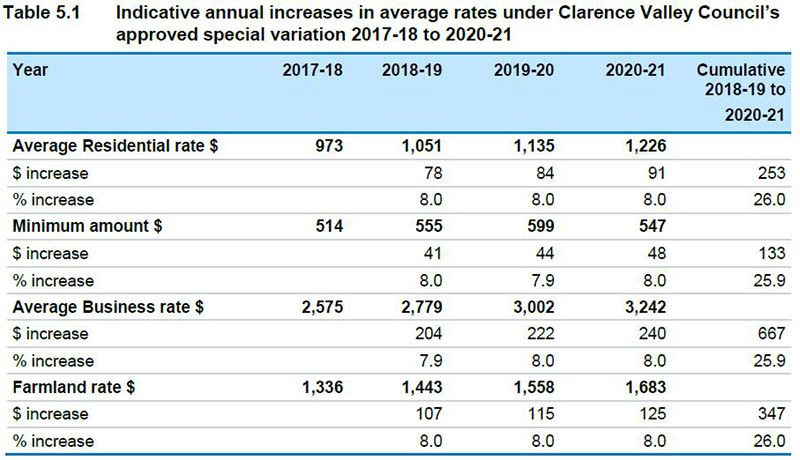
The IPART approved a permanent increase of 25.97 per cent – 8 per cent each year for the next three years (inclusive of the rate peg), after which it will remain permanently in the council’s rate base.
Overall, the council will be cumulatively better off by $10.3 million (above the rate peg) at the end of 2020/21.
Over the next 10 years, the extra $51.2 million collected above the rate peg must be spent on: roads maintenance and renewal; flood mitigation renewal; and, renewal of sports facilities, open spaces, buildings and swimming pools.
It is a condition of IPART’s approval that Clarence Valley Council (CVC) indicates in its annual report how actual expenditure compares with the proposed program.
The IPART found that CVC had met the required criteria, including financial need, community awareness, impact on ratepayers, appropriate exhibition of its community strategic plan (The Clarence 2027) and its I P & R (integrated planning and reporting) documents and that it had met productivity improvements and cost containment.
The IPART concurs with CVC’s judgement that “the community has capacity to pay, as median weekly rents ($255) and mortgage repayments ($300) are lower than the NSW median ($380 and $458 respectively)”.
The IPART’s assessment on ability to pay concludes that “the impact of the increases is significant, but reasonable”, but it noted that the valley’s Socio-Economic Indexes for Areas (SEIFA) ranking “indicates the LGA is relatively disadvantaged compared to most of its Group 4 and neighbouring councils”.
The median household income for the Clarence Valley is $47,320, whereas the local government areas (LGA) that IPART compared the valley to (Group 4 and neighbouring councils) all had higher median incomes: Bellingen $51,844, Coffs Harbour $57,564, Richmond Valley $49,556, Tamworth $61,360 and the Group 4 councils average of $62,656.
On submissions, the IPART noted that the 138 lodged with CVC expressed “overwhelming opposition to the proposed rate increases”.
The IPART received 119 submissions, including one petition with 5,448 signatures, the “vast majority” of which “opposed the application, mainly on the grounds of affordability and council inefficiency and mismanagement”.
“These concerns are similar to the feedback received by the council,” the IPART states in its report.
“We note the council’s responses to these concerns and that it has decided to apply for the rate increases on the basis of its need to improve its financial and asset sustainability” to meet CVC’s
Fit for the Future requirements.
The IPART also approved CVC’s application to “increase minimum rates by the same percentage as the special variation to distribute the rate burden equitably between ratepayers with high and low property values”.
The current minimum rate ($514) is 47 per cent lower than the average residential rate ($973) for the 2017-18 rating year.
People who paid the minimum rate of $514 in 2017/18 will be paying $647 come 2020/21.
Table 5.1- Source: Clarence Valley, Application Part A, Worksheet 5a